
Forage Outlook, scoring the land a colony can reach
How Swarmed turns satellite land cover into a per-apiary forage score, why nearby colony density is shown as its own signal, and what the score can and cannot tell you.
The Forage tab on the Contributor map dashboard is live today, showing this score for your own apiary, plus the colonies foraging nearby and how the season is tracking. Open the Forage tab.
A honey bee colony lives or dies on what grows within flight range of its hive. A beekeeper deciding where to place an apiary, or trying to understand why one yard thrives while another struggles, is really asking what the forage is actually like there.
That question usually gets answered by driving around and looking, or by local knowledge built up over years. The Forage Outlook is an attempt to answer it from data instead, reading the landscape around any point in the country and scoring how much of it is the kind of ground bees actually forage on.
Think of it as a fast, consistent first read on the land, available anywhere, meant to be checked against local knowledge and what a beekeeper actually sees on the ground rather than treated as a yield prediction.
What the score measures
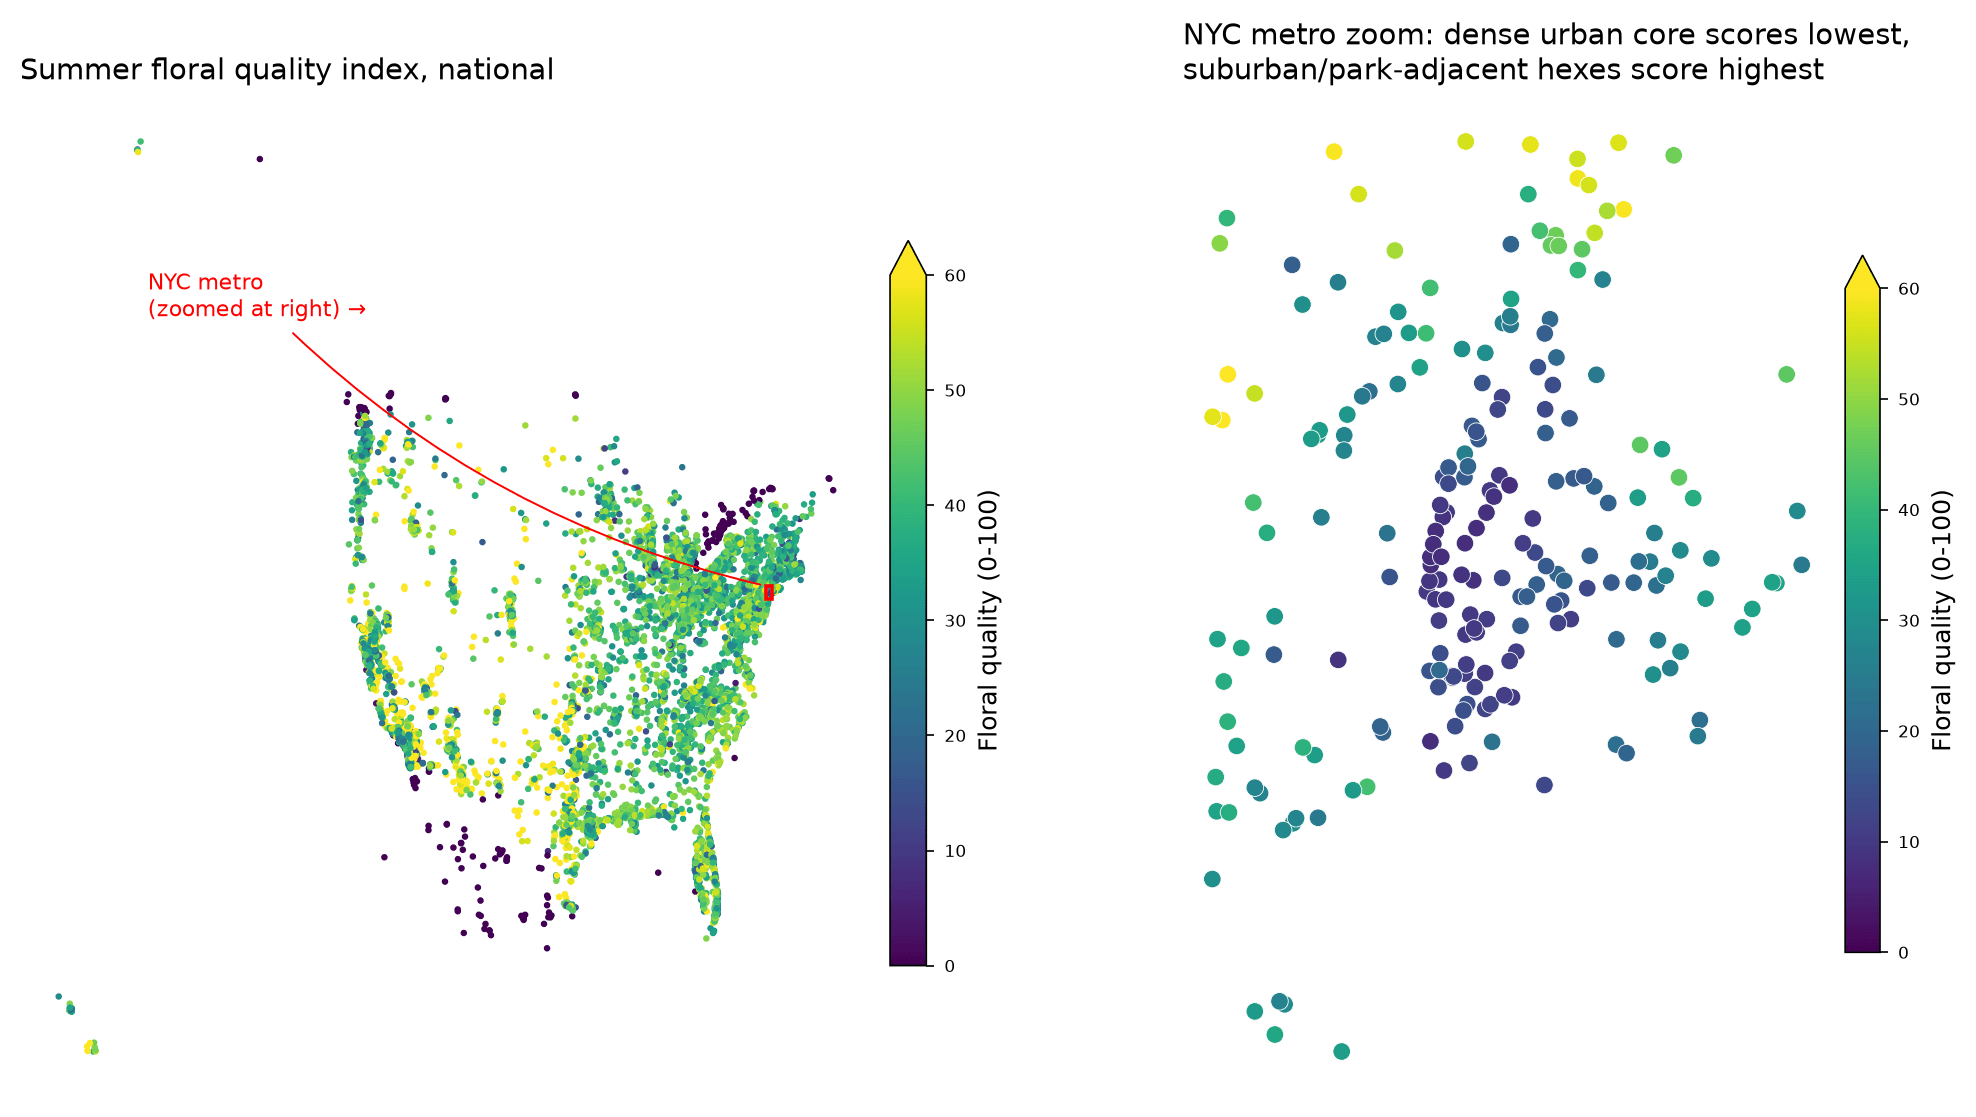
Land forage is a 0 to 100 estimate of how much of the surrounding landscape is the kind of land cover honey bees forage on, such as flowering crops, meadows, and mixed woodland edges, where a higher number is better. It is computed for every H3 hex cell (roughly 0.74 km each) across the country and shown per season.
The score is built from satellite land cover. We take the land-cover classes around a point, weight each class by how much floral value it typically offers pollinators, and combine them into a single number. The result is a map of forage potential based purely on what is on the ground, before any consideration of weather or of other beekeepers nearby.
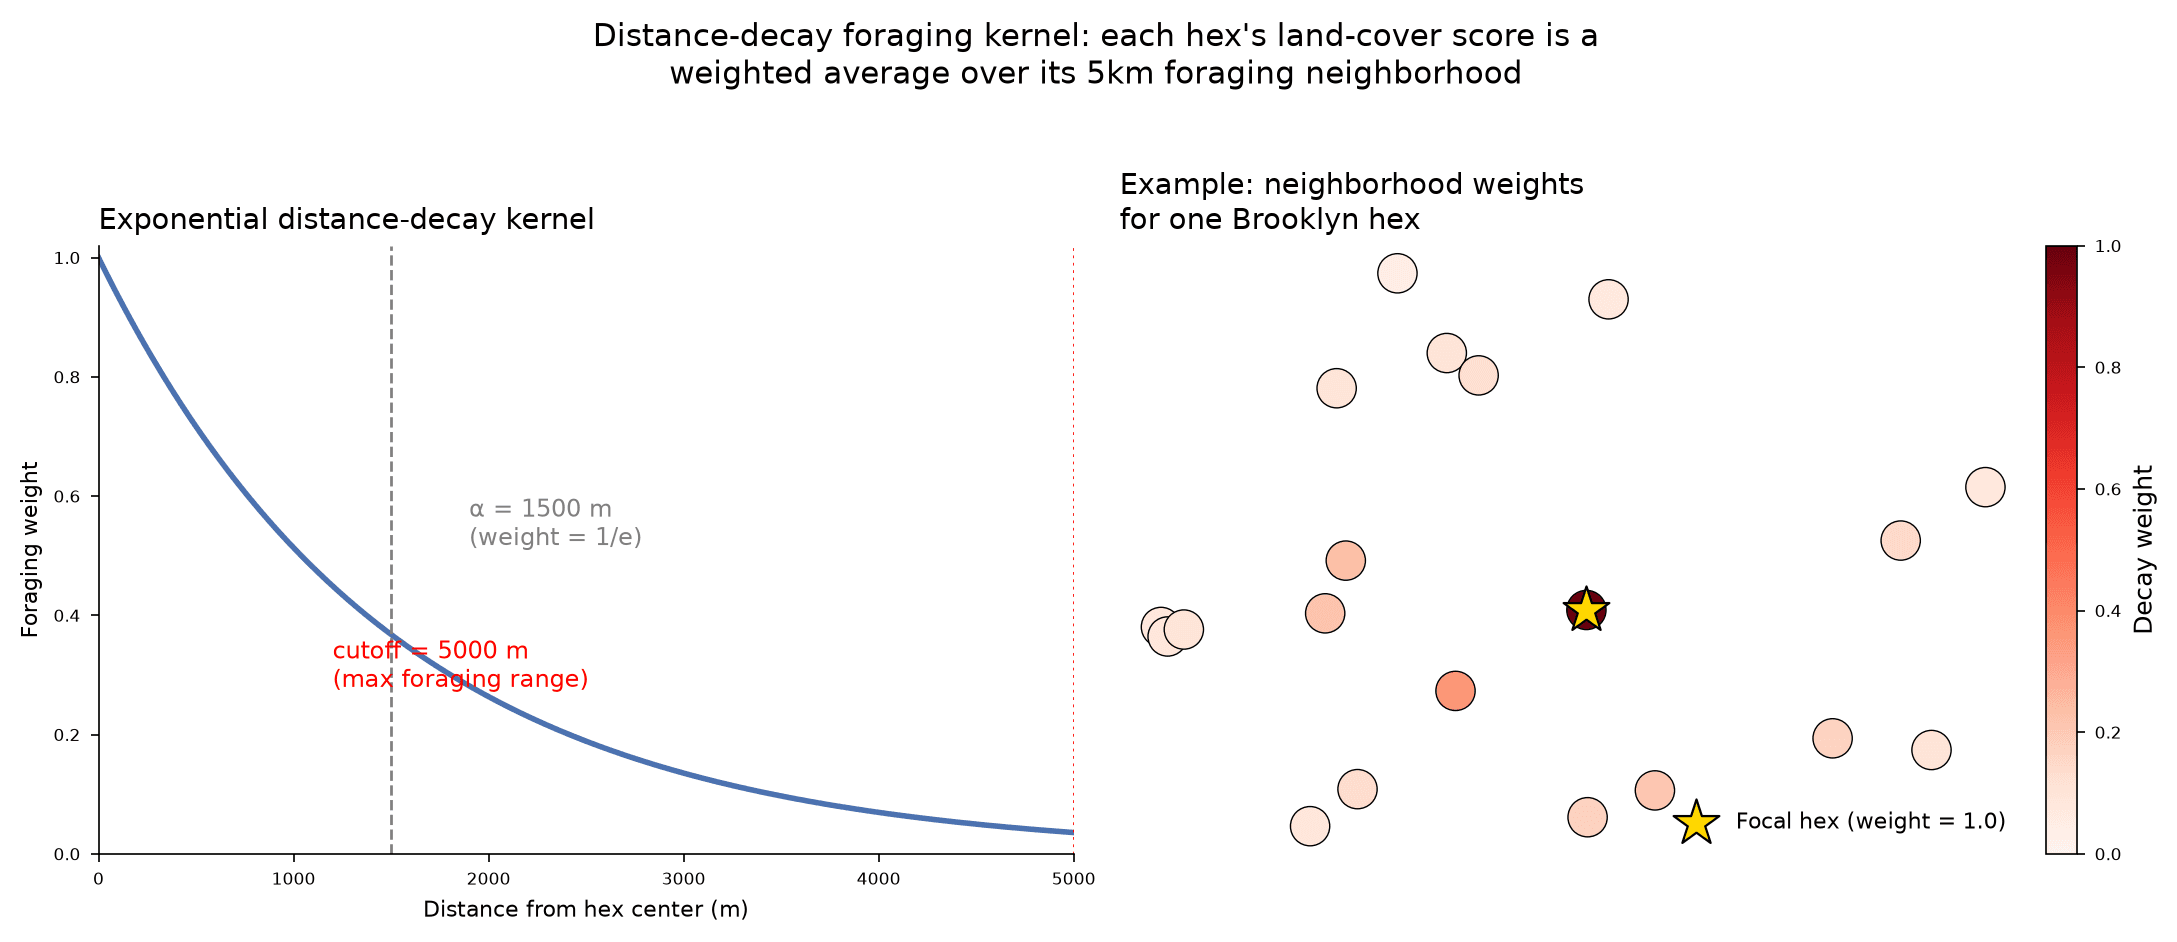
A colony forages across a radius
Bees range outward from the hive rather than foraging only on the exact hex it sits on. They value nearby land more than distant land because closer flowers cost less energy to reach, so the score for any location blends in the land around it, weighted by distance, where a nearby rich patch counts for a lot and the same patch several kilometres away counts for much less.
This distance weighting is why a hive placed at the edge of good habitat can still score well, and why an isolated good patch surrounded by poor land scores lower than the patch alone would suggest.
Good land and a crowded yard are two different facts
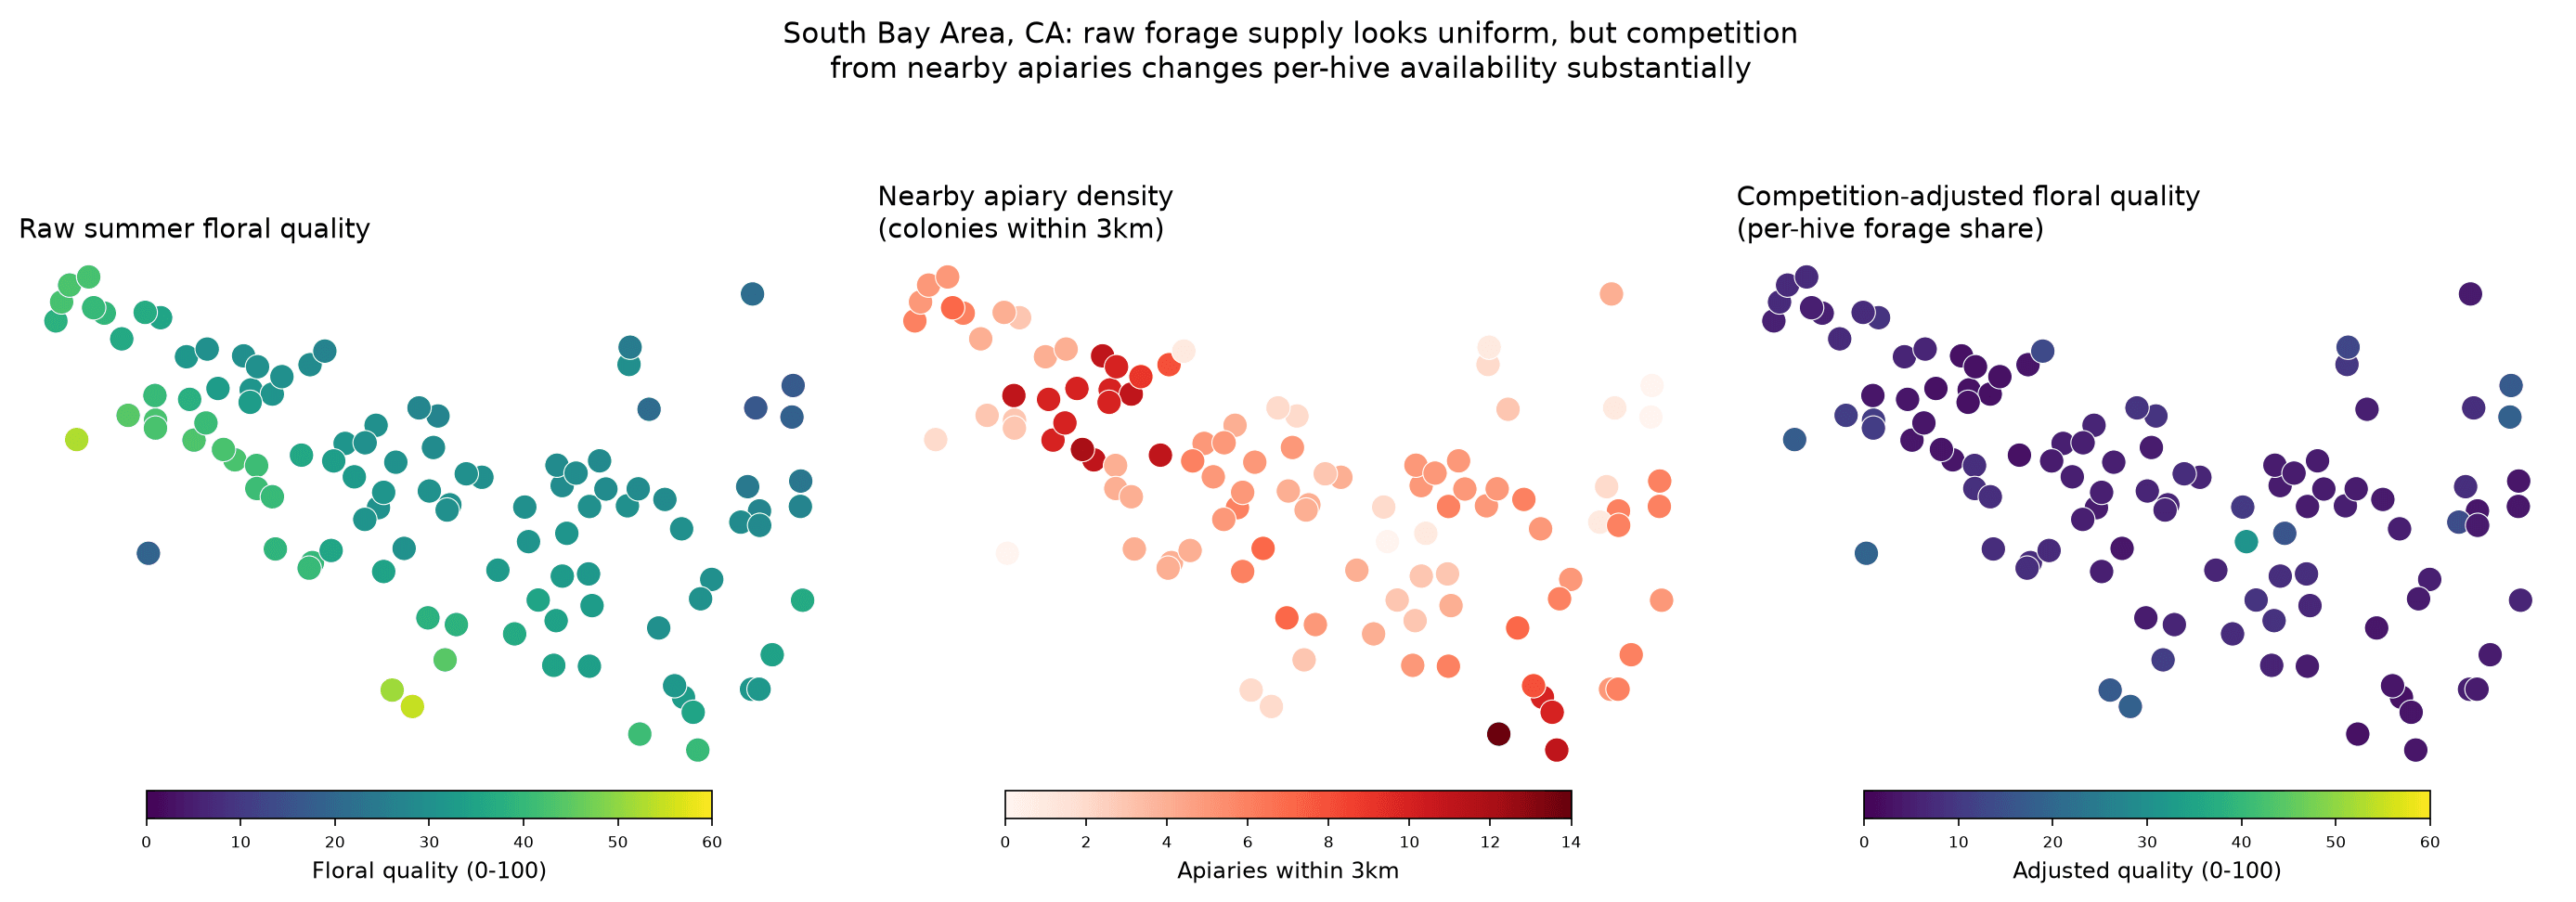
The same forage supports fewer bees when there are more colonies drawing on it. An early version of this index folded that in by dividing the land score by the number of colonies nearby, producing one competition-adjusted number.
That turned out to hide more than it showed. In beekeeper-dense areas the adjusted number collapsed toward the bottom of the scale almost everywhere, so good land and poor land both read as 'limited', purely because other beekeepers were around. The land quality, which is the thing a beekeeper can actually act on, disappeared into the crowding.
So the dashboard now shows the two facts separately, how good the land is and how many colonies are already foraging nearby.
Nearby colony counts are shown with a plus (for example 'est. 11+ colonies') because the count is built from registered apiaries and known activity. There are almost always feral colonies and unregistered hives we cannot see, so the true number should be read as a floor rather than a ceiling.
Weather-timed forecast, a research direction
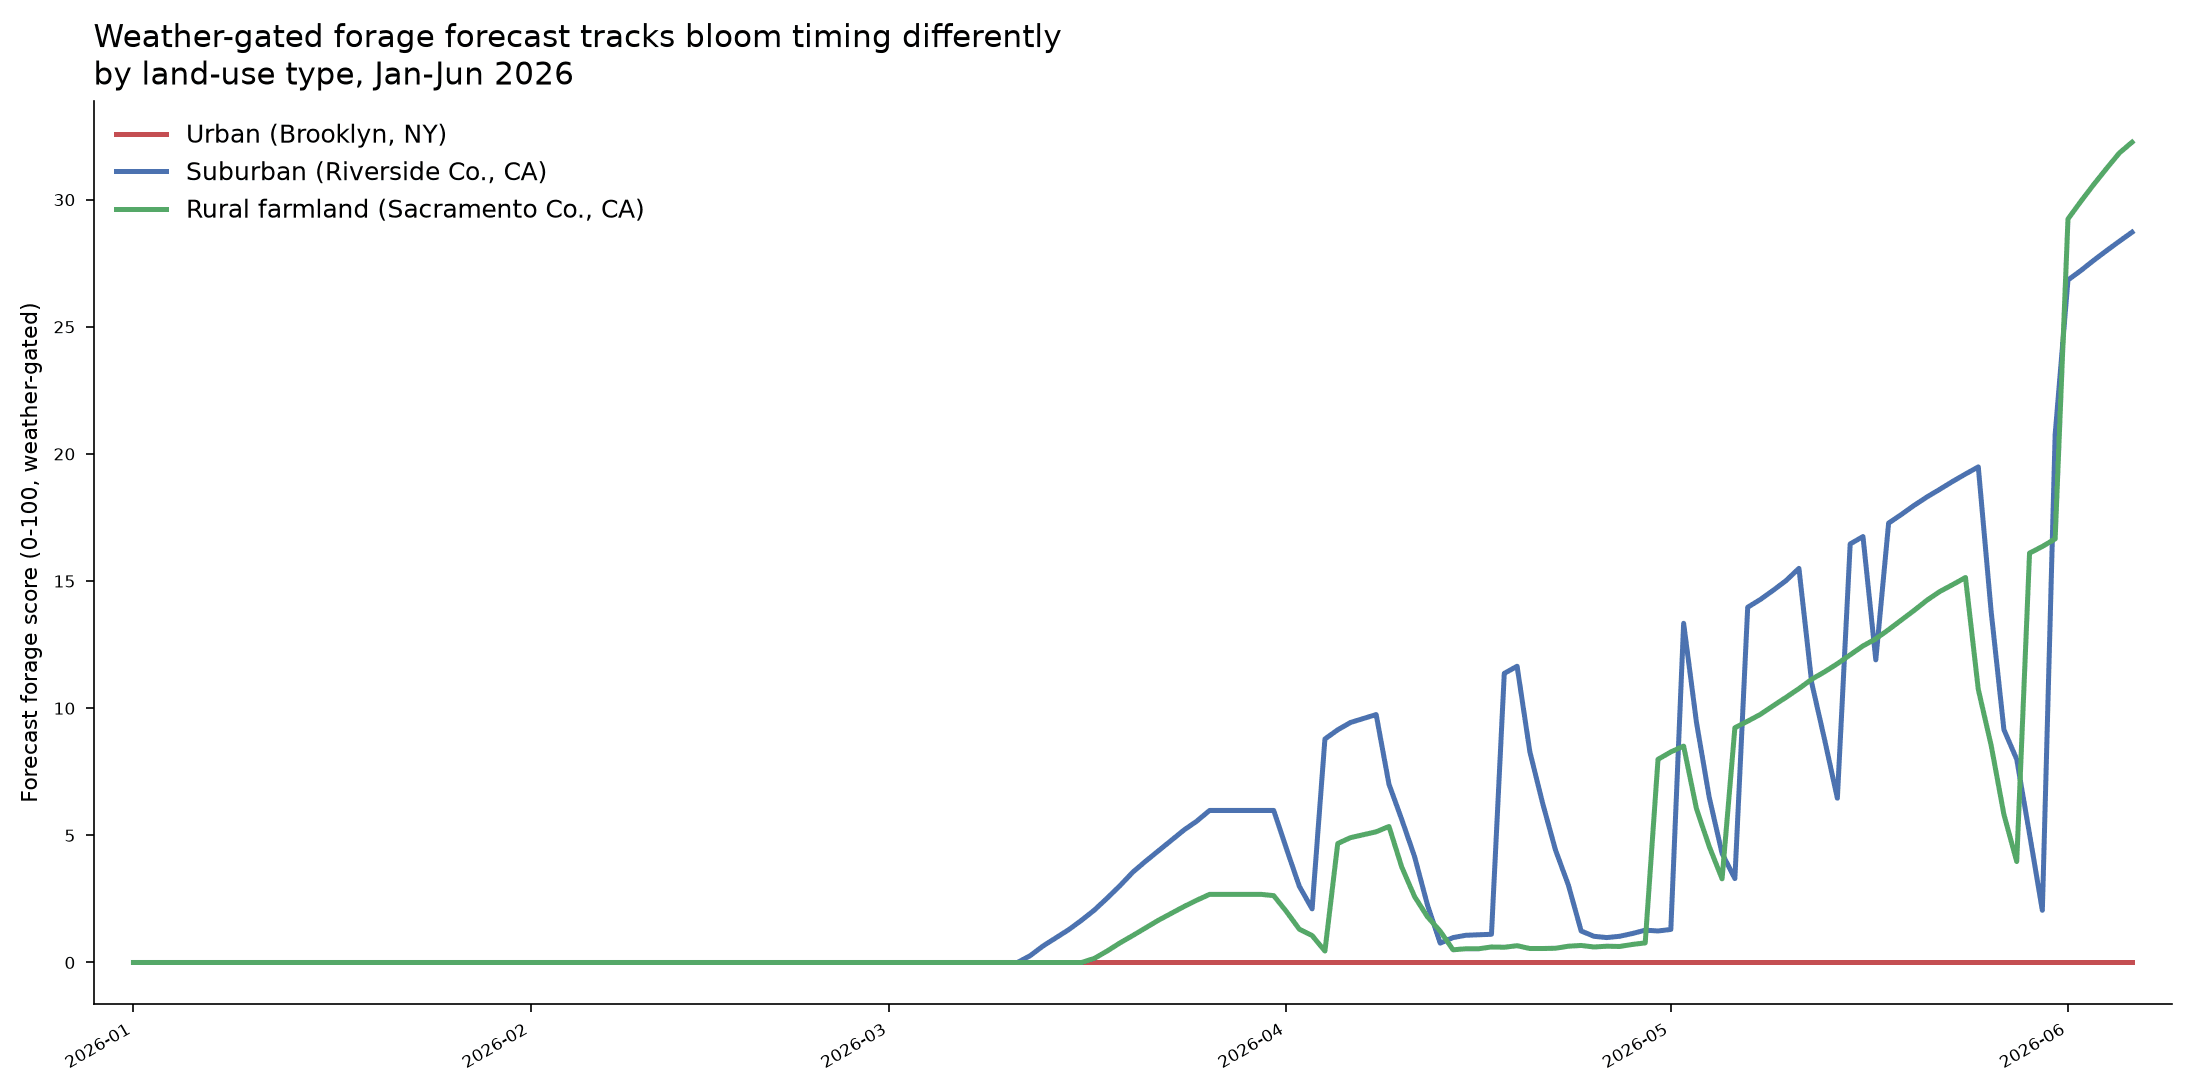
Land forage tells you what is out there without telling you what is blooming this week, so the natural next step is a weather-timed version, using accumulated warmth to estimate when each land type actually comes into bloom and lifting or dropping the score across the season accordingly.
We have built and tested this, and it is not yet reliable enough to show as a live number. The per-region bloom thresholds it depends on are confounded by how the reporting network has grown over time, so a threshold learned from the data can reflect the growth of the platform as much as the biology of the bloom. Until those thresholds hold up against an independent bloom signal, the live dashboard shows the stable seasonal land-forage score rather than a learned 'blooming today' figure.
What the dashboard does show alongside the seasonal score is a lighter-weight this-year line, the local seasonal shape adjusted by recent flight-suitable weather (temperature in the foraging band, days bees were not confined), drawn up to today and handed back to the seasonal baseline afterward, an honest read on recent conditions rather than a bloom-timing model.
Honest limitations
A forage score is only useful if you know what it is not telling you, so read it with these limitations in mind.
A land-cover estimate, separate from honey yield
The index reads the landscape a colony can reach and scores how much of it is the kind of ground bees forage on, without measuring nectar flow, weather in any given week, or how much honey a hive will actually make. Two apiaries with the same score can have very different seasons.
Land-cover classes are a coarse proxy for floral value
We translate satellite land-cover classes into a floral-quality weight using published pollinator habitat values (Koh et al. approach). A class like 'deciduous forest' covers everything from a nectar-rich basswood stand to a closed canopy with almost nothing blooming below it. The score is an approximation of potential, averaged across what that class usually offers.
National cropland detail is still partial
The per-crop breakdown ('what's growing nearby') is built from USDA Cropland Data Layer detail for a first set of counties. Outside those counties the map still scores land forage from land cover, but the crop-by-crop list may be thin or absent.
Bloom timing is still a research direction
The weather-timed forecast below is still exploratory, since the per-region bloom thresholds it would need are not yet validated, so the live dashboard shows the stable seasonal land-forage score rather than a learned 'blooming today' number, as explained further in the weather-timed forecast section below.
See the score for your own apiary
The Forage tab on the Contributor map dashboard shows land forage, nearby colonies, and this-year tracking for wherever you keep bees.