Need a beekeeper to collect a swarm? Report it here.
Log a Bee Swarm, Help Map the Season
Every swarm a beekeeper logs gives us a better idea of when and where bees swarm. Add the swarms you've caught or seen, and they support open research that helps every beekeeper.
Every state shaded by how many swarms beekeepers have reported there. Darker means more reports.
Log a swarm you caught or saw
Why your swarm matters
A signal we can't otherwise see
Where and when swarms happen is one of the clearest seasonal signals of bee and ecosystem health, but it has gone mostly unrecorded at scale.
Built from real observations
Each report is a georeferenced point in time. Together they reveal how the season shifts year to year and region to region, far beyond what any single beekeeper can see.
Open science, in time
We'll open-source these citizen-science observations on iNaturalist over time so the wider research community can build on them. Swarmed's full swarm-report dataset and live maps stay with our contributors and supporters.
Curious about the methodology, the growing-degree-day models, and the research behind this? Read about Swarmed's data.
The share of the year's swarms that have happened by each month, averaged across recent seasons. The gold line tracks where this year sits so far.
Want to see every reported swarm?
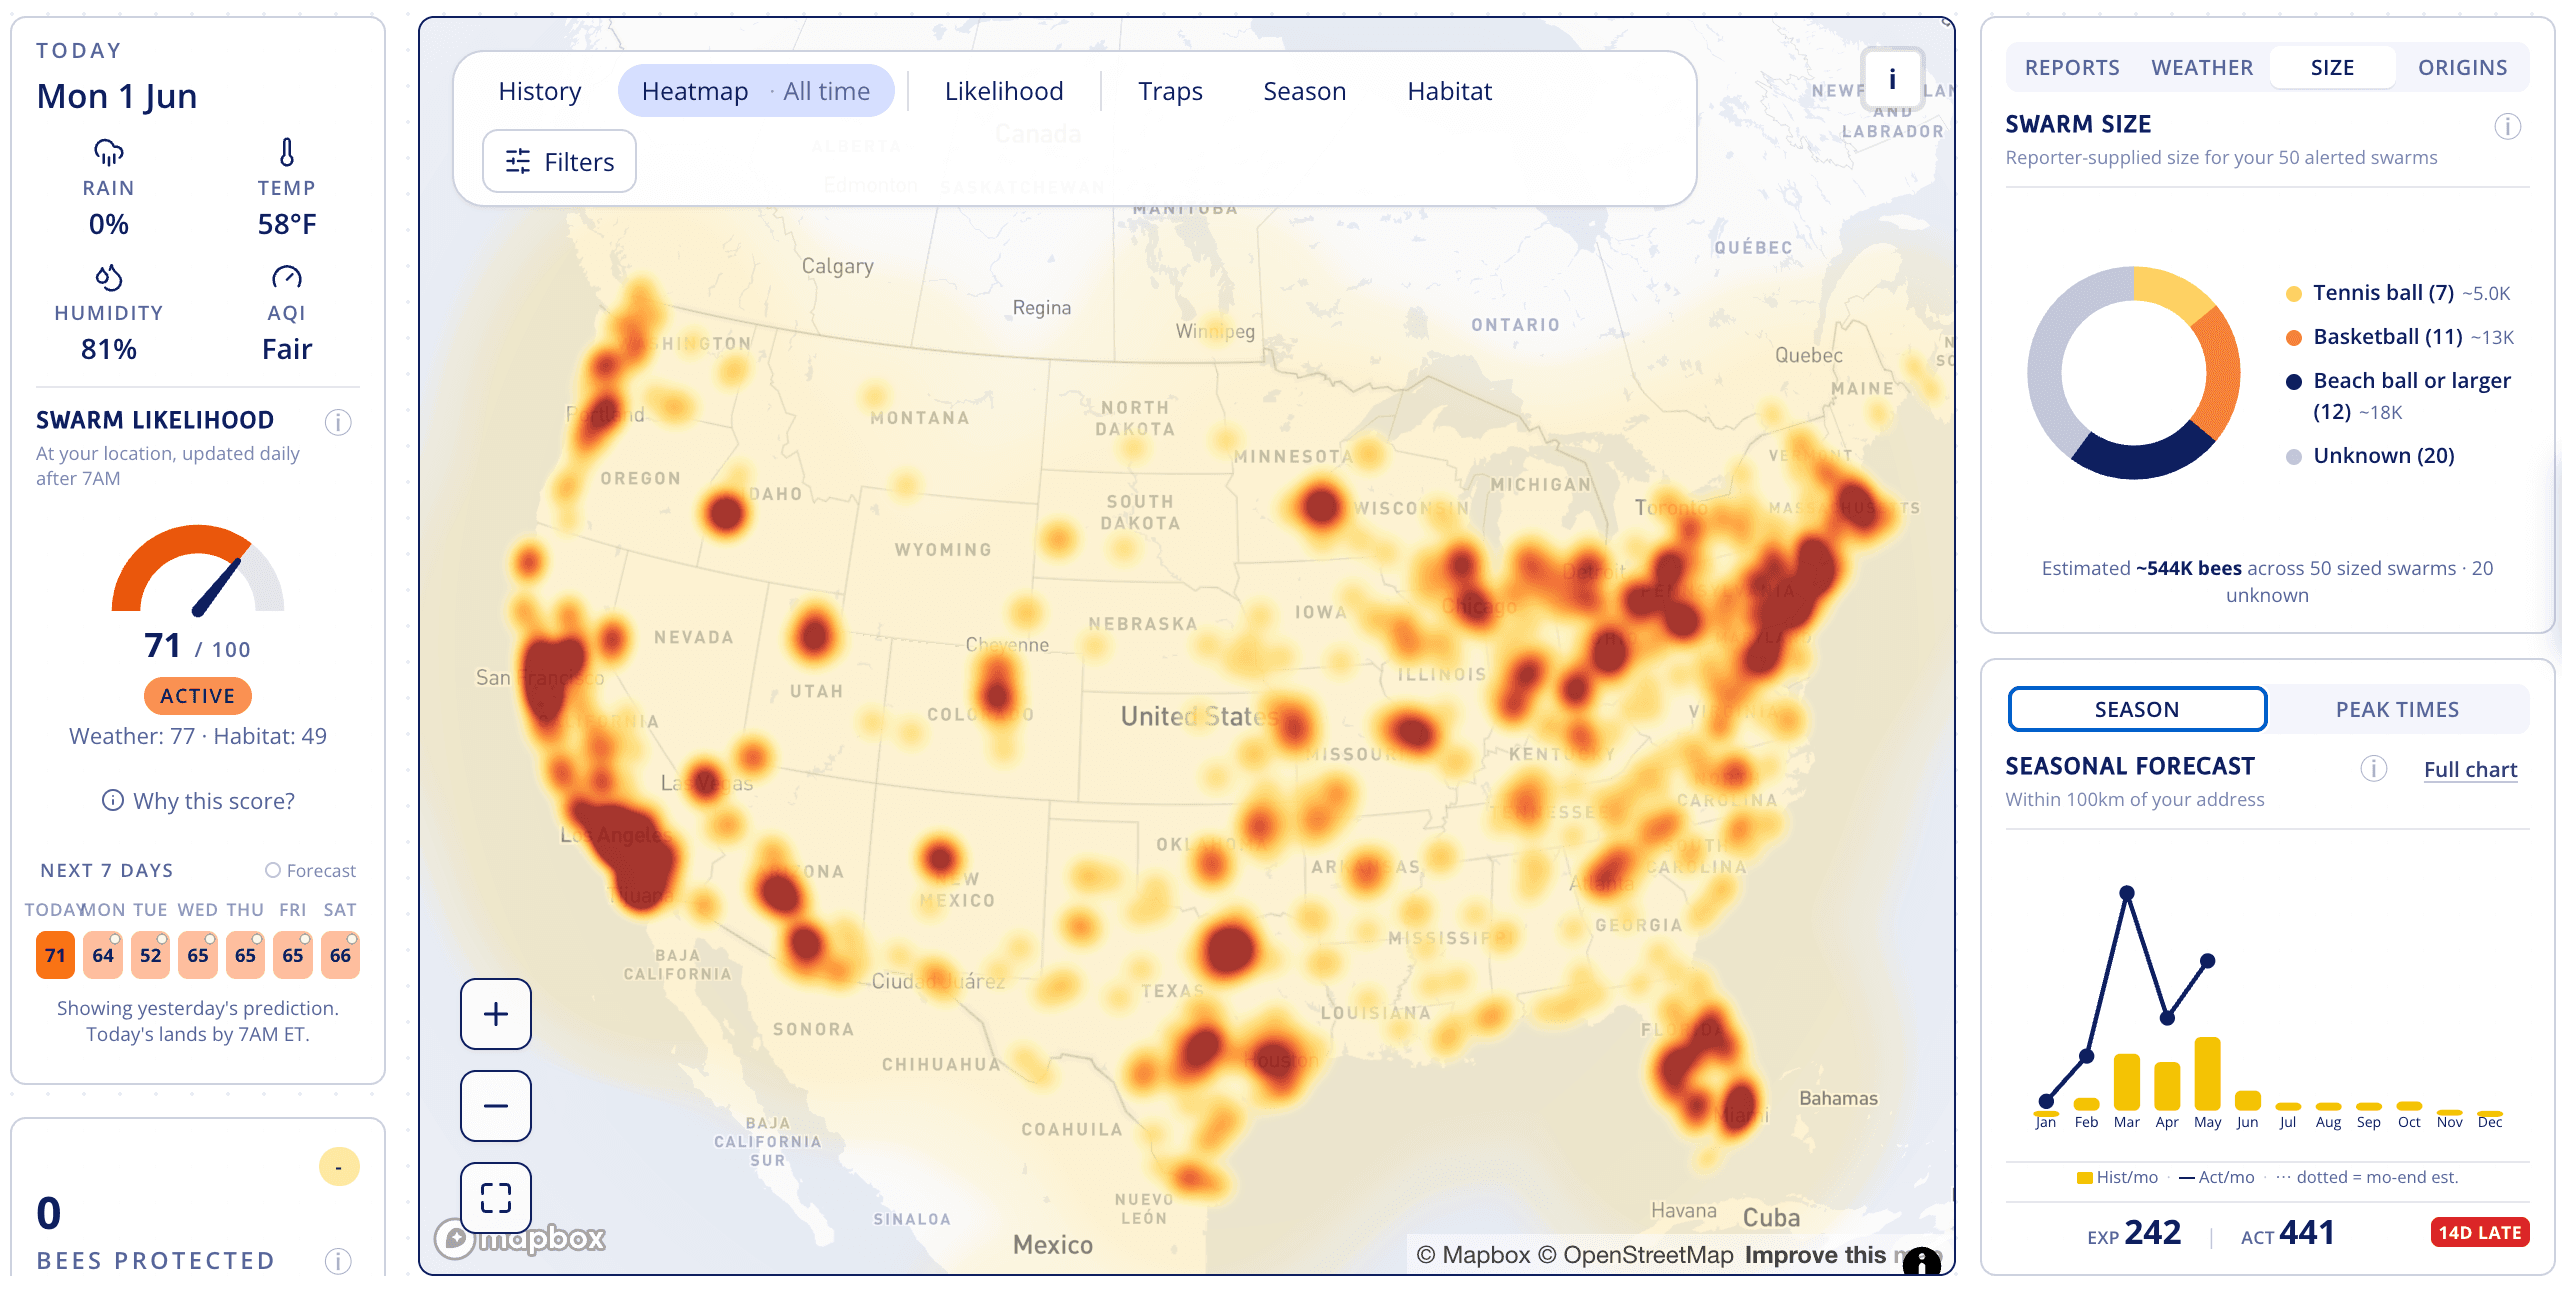
The state map shows totals by state. Leave your email and I'll send you access to the full map: more than 10,000 individual swarm reports, with the season and likelihood tools Swarmed builds for beekeepers.
Mateo, 5th generation beekeeper
Prefer to look around first? Explore the data behind Swarmed.