Back to Bee Swarm Data2026 season report

The late-season swarm outlook for 2026

Spring gets the attention, but the swarm season has a long tail. Here is what the 2026 report record shows about late-summer swarming, afterswarms, and where the season is still running strong.

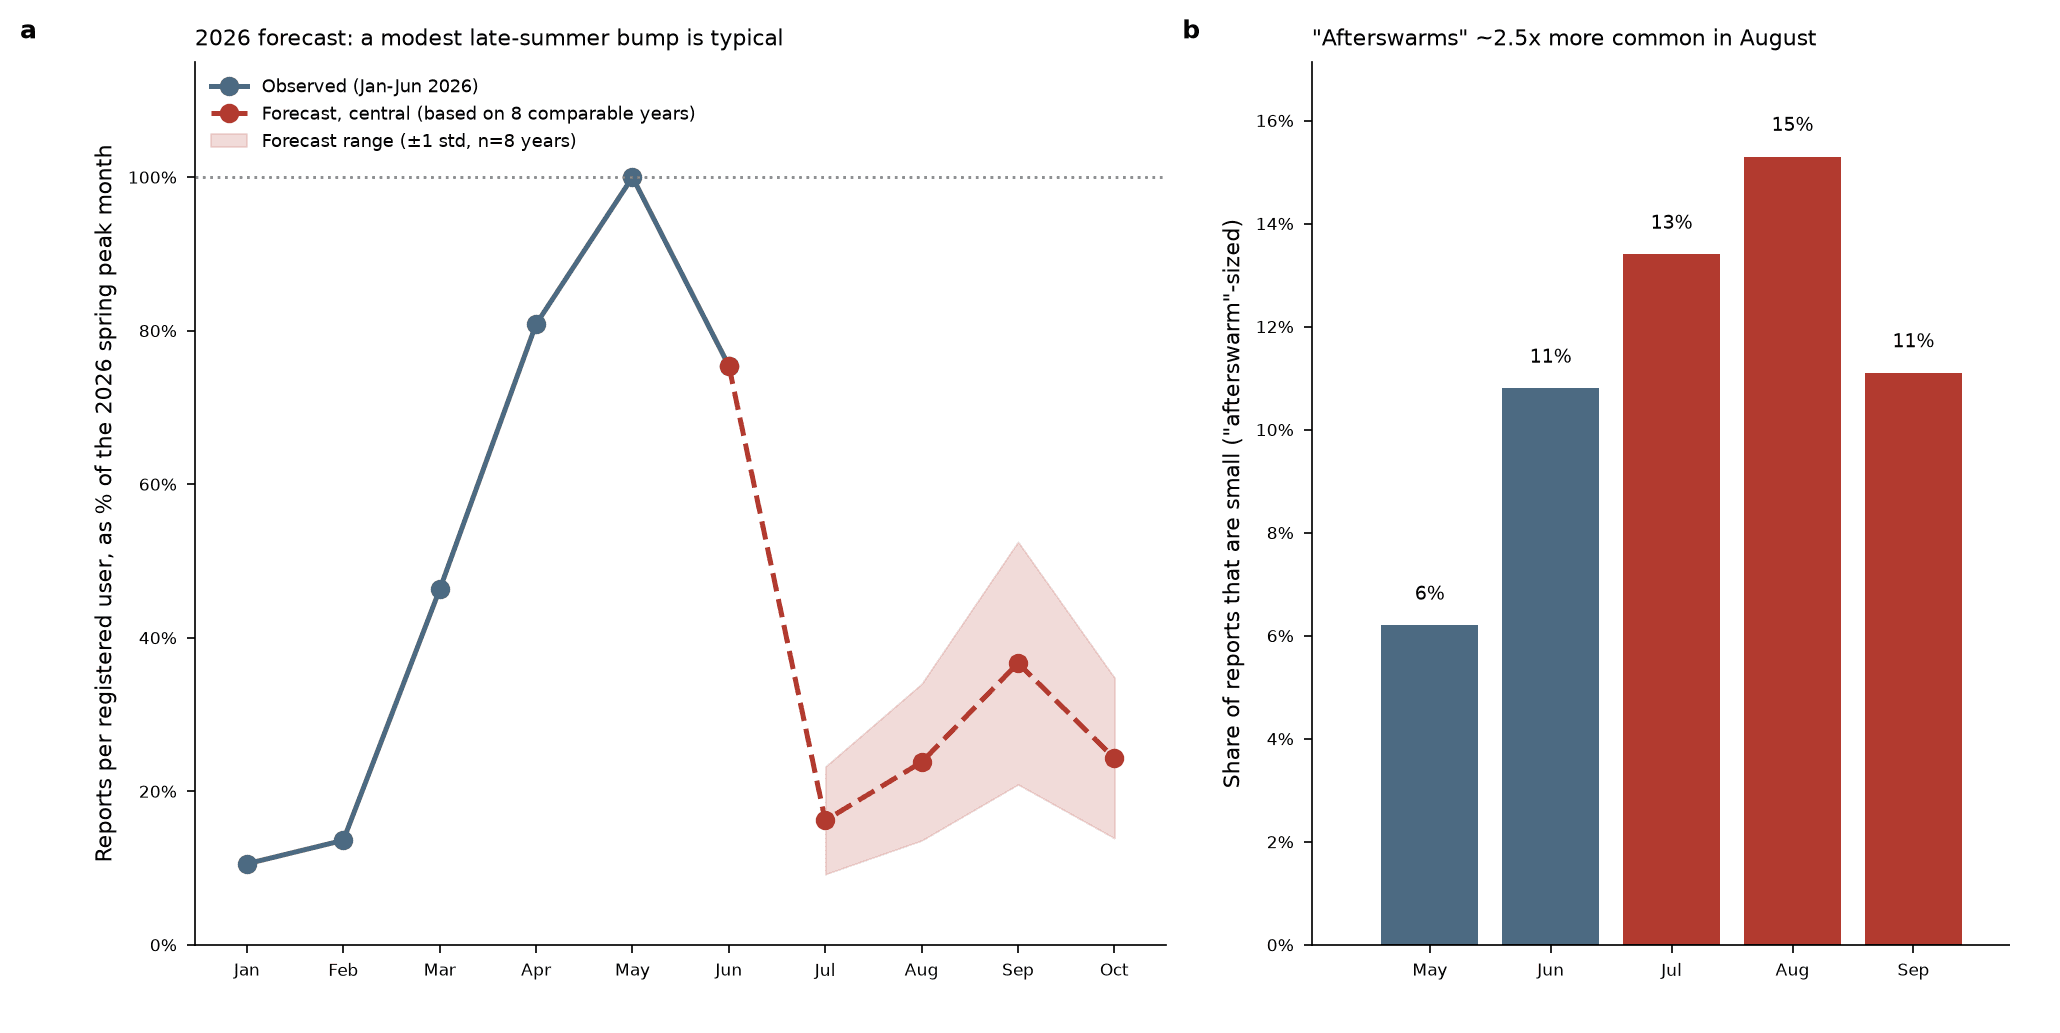
2026 late-season swarm outlook chart showing swarm activity tapering from the spring peak through late summer with a persistent late-season tail
The 2026 season curve shows a sharp spring peak, then a long late-summer tail that stays meaningfully above zero.

Three things the late season is telling us

~37%
of the spring peak

Late-season swarming continues well past spring. Across monitored regions, September swarm activity runs at roughly a third of the spring peak, enough that a beekeeper who packs the traps away in June misses a real second window.

2.5x
more afterswarms in August

Afterswarms (the smaller secondary swarms a colony throws after the prime swarm) are about two and a half times more common in August than the spring average. Late swarms skew smaller, so late trap catches are more often afterswarms than prime swarms.

3 in 4
autumn reports are established colonies

Much of what gets reported in autumn isn't a swarm. Across 2024 and 2025, three quarters of September and October reports were established colonies in walls, soffits and roof voids, against a third in April and May.

Where the late season runs strongest

The late-season tail is heaviest in the South. Once established colonies are set aside, swarm reports below about 37°N roughly doubled from August to September in 2024 and 2025. Further north, from 37 to 42°N, September stayed close to its August level.

For beekeepers in the South, the practical takeaway is simple: keep bait hives out through September. Further north the late window is smaller, but a trap taken down straight after the spring rush still misses the swarms that do come.

See how the whole 2026 season ran in the North America bee swarm season report.

How to read these numbers

These figures come from Swarmed's report record, normalized to control for the platform's year-over-year growth so that a bigger network does not read as a busier season. They describe broad seasonal shape across monitored regions rather than a forecast for any single apiary, so read areas with sparse or single-season reporting with that caveat in mind.

See how the 2026 season ran

The season report covers the whole year: when reports came in, what the late-summer rise was made of, and where it was concentrated.